Hello, guys. Since it was suggested, here are the links to the survey I'm doing for my infograph. If you would complete the survey, I'd appreciate it greatly. You don't have to answer every question, and the results are posted anonymously. There are two parts,
PART ONE http://www.surveymonkey.com/s/NKB5XT3
PART TWO http://www.surveymonkey.com/s/Z52T5FF
If you have any questions you can comment here or send an email to areitano@ufl.edu. Thanks!

Monday, February 28, 2011
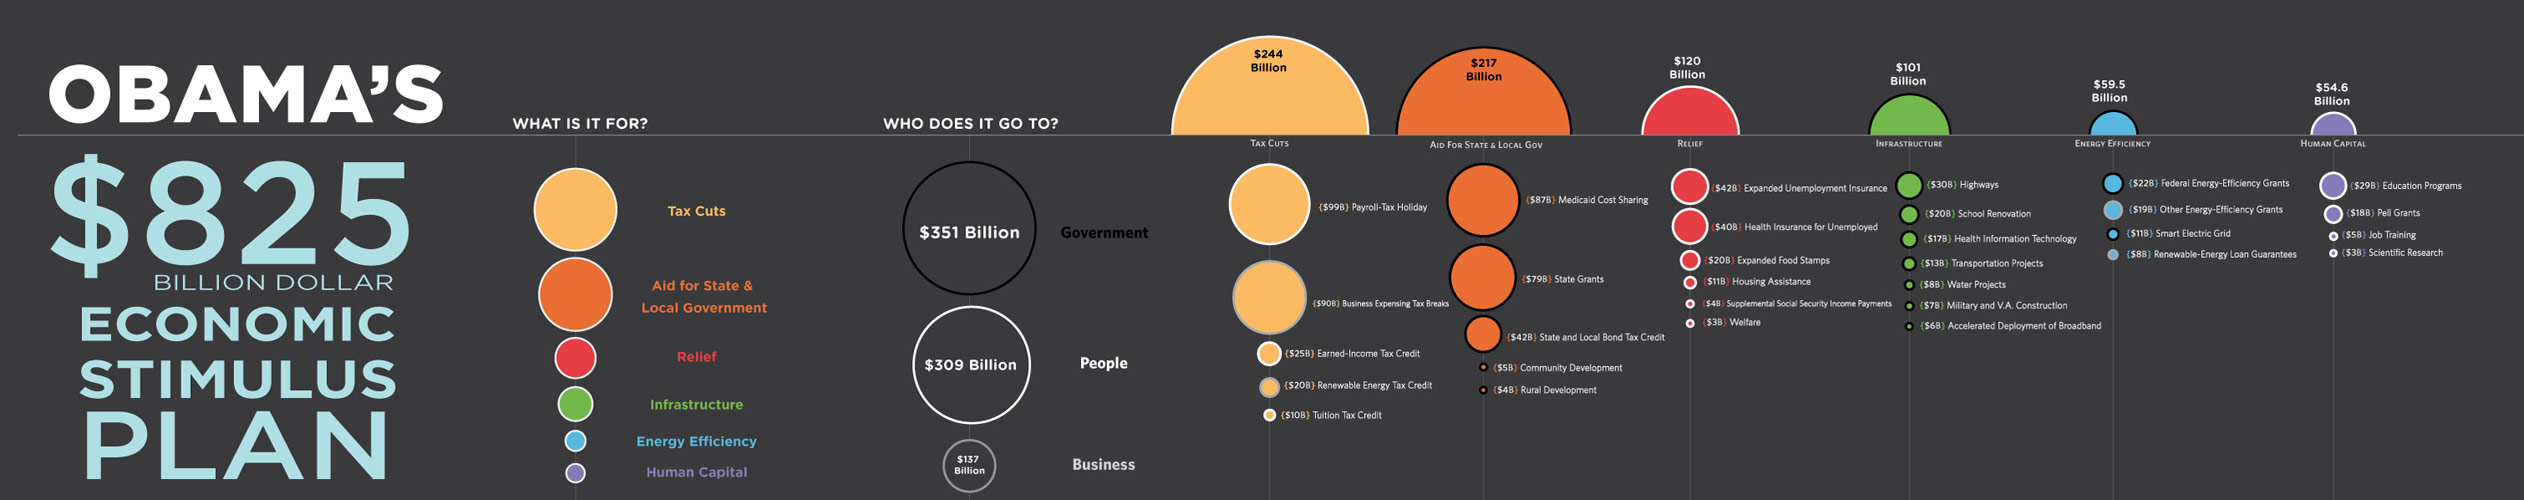
Good Map infographic
I think a couple of you guys are going to use a map in your infographic, and I found this infographic. I feel as if it uses maps very effectively because it has a varied color palette and icon legend. As opposed to the map river map that we looked at 2 weeks ago which had a very homogenous color palette and no legend.

Friday, February 25, 2011
From Good Magazine, a visually outstanding infographic
It is easy to read, simple and with a wonderful symbology: The Haitian Relief.
Thursday, February 24, 2011


Interesting Data Set
As always, the New York Times provides us with interesting formation in a clean and easy to read manner. Upon reading it, I was wondering why they didn't turn this into an infographic with the skills that we all know they have over there.
Wednesday, February 23, 2011
Some useful links for the projects! (and other things related for inspiration)
- Visualizing big numbers with real scale 1:1... One Million Book.
- Water waste, visualizing groups of people in space.
- Being sustainable... water footprint.
- Commodity price fluctuation by industry, originally posted by Sarah.
- Visualization critique: Comparing religions.
- Visualizing through maps: World Map of Religions.
- Interactive map: San Francisco Crimespotting.
- Vintage florida posters.
- Visualizing flowers, trees, leaves. Tree illustration.
- Comparative data on Christmas trees.
- Infographic to analyze a palm tree species.
- Insects... Visualizing the honey bee extinction, Facts about bees (illustration), Classification and characteristics of bees.
- Map: Drug use in the USA.
- Infographic, diagram, map: Our Favorite Drugs, The World of Drugs, The Cost of the War of Drugs.
- Drawing in Illustrator, using the pen tool. Phases of the pen tool. Download pen tool exercise.
- Live trace images in Illustrator.
Let me know if you need help finding information on specific topics.


Tuesday, February 22, 2011
PBS Infographic
This infographic was made in response to the government readying to cut public media funding: Click
Notes 2/21
On Making Field Research Visual : Maria Rogal
Ethnographic field research in Mexico supports graphic design work
Project : to visualize time in the context of the community
The desire for the project came from the community
- field notes do not need to be neat & organized
Diagrams of wheels of time - 6 prototypes, 18 group members, walk through with community
2 audiences - community & westernized Mexicans
Community has an oral tradition, the tool needs to be useful
Elders selected the circular prototype
- talking to people helps to understand peoples' needs, learn mistakes
There is a responsibility to share work
Because oral tradition, not everyone in community agreed
Their clothes tell stories & led to inspiration for project
Order/position of the text is important
Detail & color codes also important
Project map - different levels of information, can evolve
Information organization on orange juice bottles
- community wants people to know language & location
Honey bottle labels
- resonate well with community
Audience for bottles - tourists
Monday, February 21, 2011
Isotypes and iconography

Project 1 distributed by weeks, until Due Date
Hello!
We are in the second week after the presentation of Project 1, and we need to move fast to define everything related to it, because Spring Break is coming soon. These are the activities for the following days:
02.21.11: Quick presentation of topic. Justification, data found during the last days, information about topic. Preliminary audience. What's is the biggest problem to solve? (These issues correspond to the fist parts of the Creative Brief).
02.23.11: Creative Brief completion + Critique of First Sketches. The Creative Brief will serve as your base to continue developing your infographic in the next days. You will present the most important information from your Creative Brief to the class first. All of you are expected to give feedback to your classmates.
After talking about your Creative Brief, you will show your first infographic sketches. In big pieces of paper, make sketches, use color, propose structures, organizations of the information, iconography, etc. Don't work small, work in the biggest pieces of paper you can find! This will prepare you for the first prototype critique on 03.02.11. It is important to have a solid prototype to critique that day, because Spring Break is what follows.
After this critique, start working on the computer. Take into consideration the feedback and comments given in class from the rest of the class.
02.28.11: Personal meetings, students + Gaby. We will specifically define issues related to typography, hierarchy, color, scale, images or iconography. For that reason, it is imperative for you to show me print-outs or bring your computer with your visual ideas, as defined and resolved as possible.
After this meeting, make the changes needed and prepare your design for the First Prototype Critique on 03.02.11.
03.02.11: First Prototype critique. Presentation to the class of a real size printed prototype of your infographic ideas to date (plotter printing available at the architecture lab). Feedback from the class will be given, so, it is important to take notes and consider all the suggestions.
Use the following days to improve the design and carry out the user-testing activity. You are required to send me final prototype files through email anytime on March 4, 5, and 6. I will send you comments and suggestions so you can finesse the designs in time for user testing.
Spring Break (March 5-11). Use these days for user-testing activities (the earlier you do it the better). Remember that you have to keep notes and a photographic record of your user testing activity, which have to be included in your Creative Brief.
03.14.11: Final Prototype Presentation. Bring a printed prototype of your design. You will receive feedback to make the final changes before the final due date, on 03.16.11.
03.16.11: Final Infographic Critique. Formal presentation of your infographic, which will be supported by a one-page statement and your presence in the activity. Faculty from the School of Art will be invited to this presentation. You are also encouraged to invite faculty from your departments that day. This is an opportunity to show the new knowledge acquired and your ability to find a communication problem and solve it successfully.
Let's talk about this timetable in class. Remember that keeping the communication channels open between us is important to develop a better design process.
Thursday, February 17, 2011
Free fonts + Dingbats
Hi,
Check out this link. It offers the option to download a couple of really high quality fonts and a couple of dingbats collections that could work if you need some pre-determined iconography or look at symbols.
Check out this link. It offers the option to download a couple of really high quality fonts and a couple of dingbats collections that could work if you need some pre-determined iconography or look at symbols.
Typography Portraits
This is a really stunning use of typography:
http://27.media.tumblr.com/tumblr_lfu5ght9F51qgevvso1_500.jpg
as well as this compilation: http://abduzeedo.com/45-amazing-type-faces-typographic-portraits and http://www.hongkiat.com/blog/28-excellent-examples-of-typography-portraits/
http://27.media.tumblr.com/tumblr_lfu5ght9F51qgevvso1_500.jpg
as well as this compilation: http://abduzeedo.com/45-amazing-type-faces-typographic-portraits and http://www.hongkiat.com/blog/28-excellent-examples-of-typography-portraits/
Wednesday, February 16, 2011

More great infographics
check out the category list on the right side, may help to find relevant infographics for all of our diverse ideas!
http://www.visualinformation.info/
http://www.visualinformation.info/
Really Pretty Infographics
I really like all of these. I found the Burning Man one really interesting and kind of funny in a morbid way.
http://www.good.is/post/transparency-good-s-most-popular-infographics-of-2010/
http://www.good.is/post/transparency-good-s-most-popular-infographics-of-2010/
Infographic on Prices of Food
Commodity Price Fluctuations
Paul, here's a lot of information on the fluctuating prices of different foods used by a lot of communities. I hope it helps.
Glen, there's a graph of the price of coffee as well, but only up to 2009.
Paul, here's a lot of information on the fluctuating prices of different foods used by a lot of communities. I hope it helps.
Glen, there's a graph of the price of coffee as well, but only up to 2009.
More water/river-related infographs
http://cryscresc.net/world-rivers-day-infographic - World's Largest Rivers
href="http://unclutteredwhitespaces.com/2010/08/an-infographic-on-the-coming-water-wars/ - Water Wars
http://pixelfox.artician.com/portfolio/Save-Water/ - Save Water
http://cryscresc.net/world-rivers-day-infographic - World's Largest Rivers
href="http://unclutteredwhitespaces.com/2010/08/an-infographic-on-the-coming-water-wars/ - Water Wars
http://pixelfox.artician.com/portfolio/Save-Water/ - Save Water
Adobe Programs - What's the Difference?
Not being familiar with Adobe Illustrator or InDesign before the start of this course, I found this article useful for explaining the core differences between the programs (it also touches on Photoshop as well). Thought I'd share :)
Article
Article
In-Class Exercise References (02.16.11)
Hello!
Today we will use these links in our in-class exercise... If you have the chance to read the articles in advance, even better! –We will concentrate in the Mississippi River Map–
Something about Maps.
On River Maps.
Today we will use these links in our in-class exercise... If you have the chance to read the articles in advance, even better! –We will concentrate in the Mississippi River Map–
Something about Maps.
On River Maps.
Tuesday, February 15, 2011
Poster-Style Infographics Site
A whole site dedicated to poster-style Infographics. To help our creative, brainstorming thoughts for our first project :)
Style & Flow
Style & Flow
Really interesting, interactive infographic on the number of times things are mentioned on social media sites.
Monday, February 14, 2011
smoking

Here is an interesting infographic expressing the black market tobacco trade
it shows many different infographic strategies.
Thursday, February 10, 2011
Wednesday, February 9, 2011
For all of you who are like me...
"Learn the Basics of Photoshop in Under 25 Minutes" by Adam Dachis with Lifehacker.
http://lifehacker.com/#!photoshop/5753459
Lifehacker also has a couple more posts about Photoshop, and just a wealth of cool information. The whole Gawker media blogosphere is amazing - there's something for everyone.
http://lifehacker.com/#!photoshop/5753459
Lifehacker also has a couple more posts about Photoshop, and just a wealth of cool information. The whole Gawker media blogosphere is amazing - there's something for everyone.
Daily Infographics
You can have a new infographic delivered to your inbox daily! Check this out:
http://dailyinfographic.com/
http://dailyinfographic.com/
Tuesday, February 8, 2011
Monday, February 7, 2011
Creating Your Own Fonts
This website allows you create your own fonts through its own on-site builder. You can save, share, and download and use the fonts you make as well as fonts made by other users.
Images from Class
For those of you who didn't get a chance to jot down everything from the lecture in class Monday, here's a website with all of the information in one place to make studying much easier.
Egypt
Also, here's a very interesting infographic that displays the role that twitter is playing in the Egyptian Crisis right now. It's interesting how integrated twitter has become within news outlets and journalism.
If you have a twitter, search #infographic and you'll definitely come across a wide variety of interesting things that are very relevant to what's going on around us.
Superbowl
To connect to this weekend's festivities, I figured I'd share this infographic with everyone. If you're into football or the superbowl, you'll probably find it interesting.
Saving files in InDesign CS4 from CS5
Hello,
I forgot that saving a file in CS5 to be opened in CS4 is not exactly easy, the wording is a little bit confusing.
For doing so you have to use File > Export and choose InDesign Markup Language (IDML). This will let you open it in CS4.
I honestly ignore why the Adobe people decided to rename this action... It used to be very easy before.
I guess this will clarify the confusion. :)
Article - Data artists: Visualization as a gateway drug
http://www.newscientist.com/blogs/culturelab/2011/02/data-artists-visualisation-as-a-gateway-drug.html
Also check out the link to the Many Eyes project!
Friday, February 4, 2011
Data Pathways in Science
The link is for a KEGG Pathway, reference pathway. (KEGG is Kyoto Encyclopedia of Genes and Genomes)
Posted this of an example of an information graphic that is used more as a resource than as a news sensation. It is an overwhelming amount of information, especially since genomes and biochemical pathways are not my forte, but it is pretty impressive. :)
Posted this of an example of an information graphic that is used more as a resource than as a news sensation. It is an overwhelming amount of information, especially since genomes and biochemical pathways are not my forte, but it is pretty impressive. :)
Wednesday, February 2, 2011
Simple Infographic.
In the film Journalism in the Age of Data we saw that a lot of the info-graphics were made using java, php and various other computer programs. I was looking online for simple ones that we could do. This one seems like we could do just using Illustrator. I would like practice composing these shapes and such.
Co.Design Infographics
Not only does this website have lots of stunning infographics to browse (it has an Infographic of the Day feature), it also has a variety of articles about design. I found the layout of the website itself visually interesting; I especially like the colored bars that allow you to search the archives by date.
http://www.fastcodesign.com/tag/infographic
There's also a funny app that I found through the Co.Design site. It shows the asymmetry of your face. The results are not very realistic, but I'm definitely going to check it out in the App Store.
http://echoism.org/
Hope you all enjoy the sites and are having a good week so far. See you tonight!
Tuesday, February 1, 2011
Subscribe to:
Comments (Atom)