http://www.fastcompany.com/1749649/5-infographics-tools-for-business
5 web programs for making infographics!

Tuesday, April 26, 2011
Tuesday, April 19, 2011
Any Star Wars fans?
Episode 5 retold in infographic form
http://img39.imageshack.us/img39/3884/starwarsiconascope5a01.jpg
ALSO... our last class is tomorrow! Just wanted to say thanks to everyone for being awesome and for all the peer feedback given. Good luck in all your future endeavors and have great summers!! :D
http://img39.imageshack.us/img39/3884/starwarsiconascope5a01.jpg
ALSO... our last class is tomorrow! Just wanted to say thanks to everyone for being awesome and for all the peer feedback given. Good luck in all your future endeavors and have great summers!! :D
Monday, April 18, 2011


Friday, April 15, 2011
Came upon this website: NSF's science visualization challenge. Check out the past winners, and there's a section for informational posters!
Wednesday, April 13, 2011

Tuesday, April 12, 2011
Adobe Creative Suite
I got an email about the newest version coming out...$300 for students
Adobe Creative Suite
Adobe Creative Suite
Sunday, April 10, 2011
Idea for Sarah
I saw this horizontal design, and while I feel certain aspect of it are too busy and hard to read, I think it really lends itself to showing the process from start to finish and it reminded me of your design.
http://submitinfographics.com/all-infographics/an-infographic-about-how-our-laws-are-made.html
http://submitinfographics.com/all-infographics/an-infographic-about-how-our-laws-are-made.html
Saturday, April 9, 2011
Not an Infographic but...
It's an illustrated pie chart, and pie charts seem to be a theme in this class. It's a representation of America's 2011 budget. Enjoy this pie: http://29.media.tumblr.com/tumblr_lje84yPWfP1qap046o1_500.png
Friday, April 8, 2011

Thursday, April 7, 2011
Infographic about Infographics
http://nextround.net/upcoming/thumbs/2011/04/07/Teh-Infographic-Infographic-full.jpg

Wednesday, April 6, 2011
Things move fast in the design world

I totally scratched all previous ideas and randomly came up with the idea for a board game. This way, I could show progress, but would still be able to maintain a fun design and loud colors. I think that I'll be able to really show all of the different aspects that I wanted to initially with this new layout, but before I get too far, I'd love some feedback.
Tuesday, April 5, 2011
notes 04/04
Very Brief Thoughts on Scientific Poster Design
Jorge Perez-Gallego
Scientific Poster Design
- Title , make it look cool
- Layout guides the audience
- Different blocks of information are self contained
- Lots of pictures
- Small amounts of text
Scientists
- 75% of your times is spent doing research
- Throw a poster together at the last minute
Place information into a template
Designers
- Know your audience
- Know their level of background information
Approach
- Do not use comic sans. Ever.
- A picture is worth a thousand words
o Graphs
o Drawings
o Figures
- Form follows function
- Stands out and makes impact
- Remember though, you’re science comes first!
How broad is the scope of the conference?
Is there a poster session at the conference?
Can I reuse the poster?
Donate it to a community center or educational center!
Am I willing to take risk?
You will fail initially! But practice make perfect
Tips:
- Think outside of the box
- Put a portrait of yourself on the poster
- Take home handouts
- 3D artifacts
- Physical interactivity (post-its)
Do not just put things on the poster for the sake of it, it has to have a reason and purpose within the subject
Earth is a lumpy potato!
A different kind of science visualization, a colorful map of Earth if it were all covered by water.
Education Infographics
10 really awesome inforgraphics about educational spending all over the world and statistics about where we stack up to other countries.
Monday, April 4, 2011
Have you updated your browser yet?
I dunno if you all use Firefox or not, but there's a new version out. I hear it's good and has some new features, but that stuff is kind of over my head. I updated and really I've been slow to adjust to the obvious, basic changes. Just thought I'd post this. There's an infographic for everything, it seems!
Firefox 4 infographic
Firefox 4 infographic
Sunday, April 3, 2011
How little changes can do big things
Here are the top 50 examples of how companies have changed their logos overtime :)
Thursday, March 31, 2011
Informationisbeautiful.net
Andrea, here's another find for you. Not quite like your drug infographic, but an interesting classification of drugs.
Wednesday, March 30, 2011
Bom Chika Wah Wah
Hey there. Updated version of project two from after class. Let me know what you think of combining such a technological setting such as facebook with the hand drawn images.
Tah Dah.
Tah Dah.
The game of life-style infographic
Hey Claire,
Thought of the Life idea for your infographic when I saw this one:
http://awesome.good.is/transparency/009/trans009ondriving.html
Thought of the Life idea for your infographic when I saw this one:
http://awesome.good.is/transparency/009/trans009ondriving.html
When couples are most likely to break up
Keep this one in mind when planning your April Fool's jokes..
Some science infographics
This one is awesome because of its use of scale. It's about evolution.
This one is a good example of how to make an infographic interactive. It's about spacecrafts.
This one is also interactive. It's about the Hadron Collider.
Tuesday, March 29, 2011
Project 2

Here's the initial set up of my project two. I want it to look very realistic, so I'm using the actual site to work from. I think that this is going to end up being very successful.
Monday, March 28, 2011
A Couple of Infographics
This first one is about comic book characters. It's fun and uses very little text.
Marvel Family Trees
And this one is about college costs. I think it's really nice looking (I like the monopoly reference), and it's also kind of relevant to our lives.
College Costs Graphic
Hope everyone had a good weekend.
Marvel Family Trees
And this one is about college costs. I think it's really nice looking (I like the monopoly reference), and it's also kind of relevant to our lives.
College Costs Graphic
Hope everyone had a good weekend.
Wednesday, March 23, 2011
Infographics from Twitter :)
How Big is your Byte. Measuring data amounts as real world everyday examples. http://ow.ly/4l1Tj
The classification of fruit. http://ow.ly/4d9x7
Infographic of the Day: The Facebook Map of the World | Co.Design http://ht.ly/4l1w6
The classification of fruit. http://ow.ly/4d9x7
Infographic of the Day: The Facebook Map of the World | Co.Design http://ht.ly/4l1w6
Monday, March 21, 2011

Sunday, March 20, 2011
Radiation Infographic
Interesting infographic by XKCD comics that relates radiation dosages from natural sources, to those you might get from medical treatments or from nuclear reactors.
Radiation Infographic
Radiation Infographic
Revised infographic


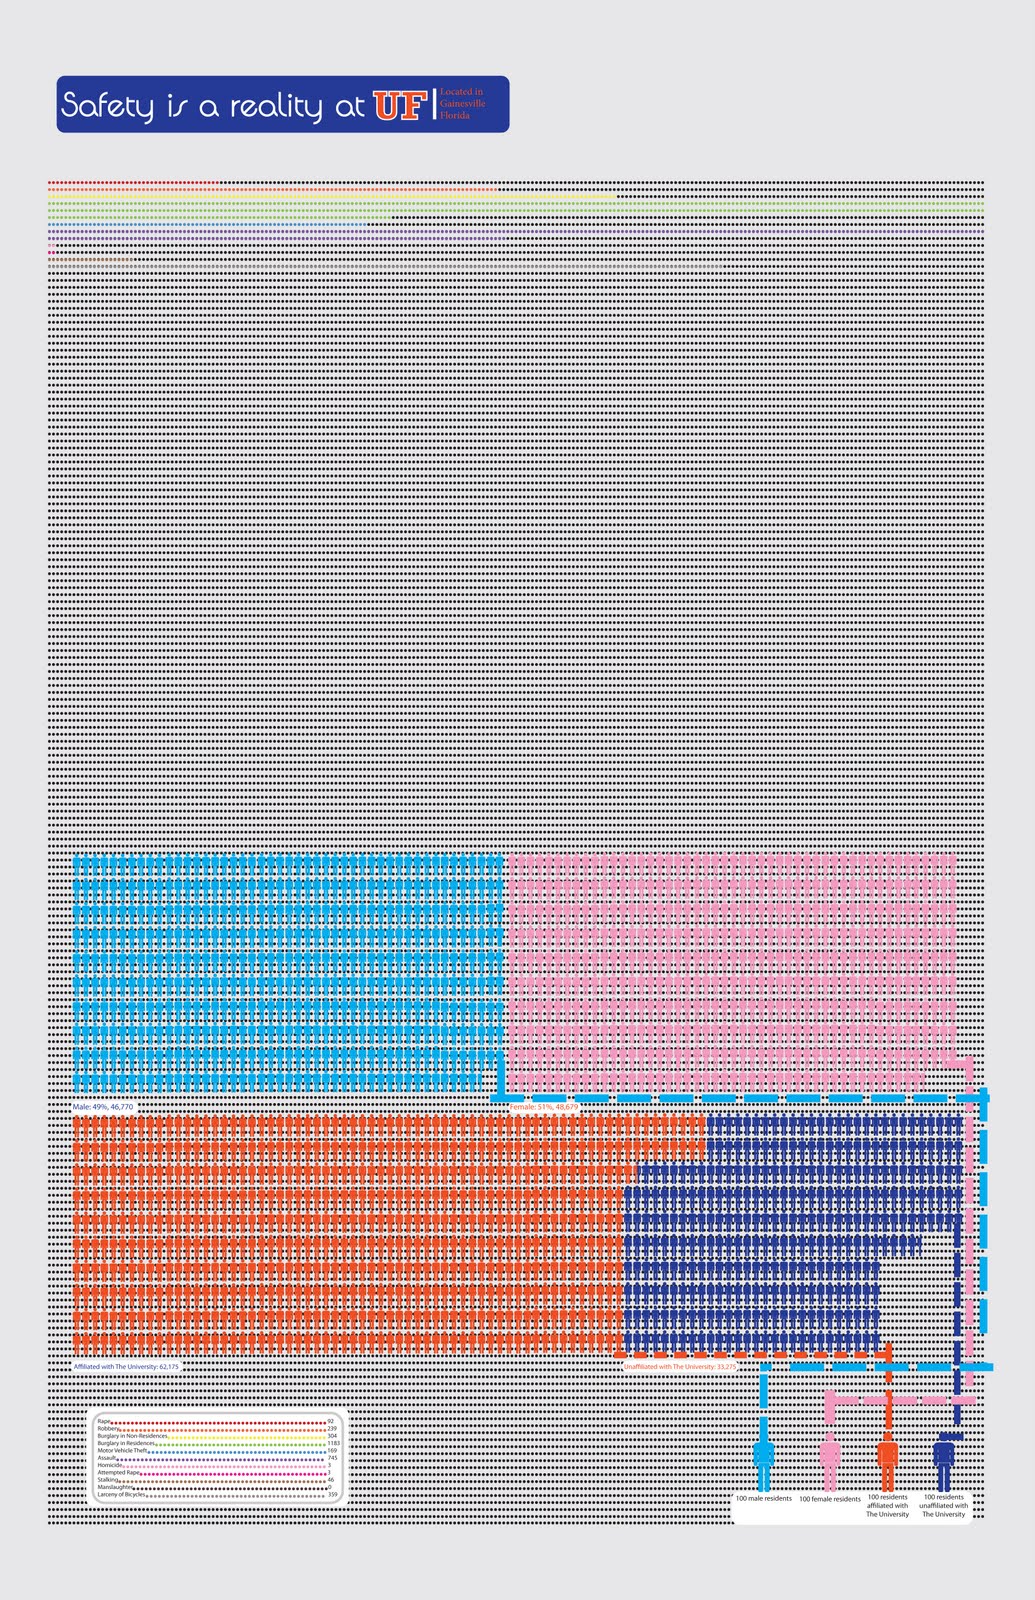
Hope everyone had a good weekend! If people wouldn't mind looking at my final infographic, that would be appreciated! I want to user-test it tomorrow. Is there too much text? Are the colors ok? Is everything clear? On the bottom right is the whole poster and then I split it up into 1st and 2nd halves on the left. Thanks!
Friday, March 18, 2011
what we pay for a gallon of...
Interesting infographic that compares the prices of paying for a gallon of different liquids.
Thursday, March 17, 2011

Wednesday, March 16, 2011
Link to Infographic analyzed in class (03.16.11)

Tallest mountain to Deepest Ocean Trench: Land/Sea
One page analysis on its use of typography, color, scale, and images by Monday, March 21st.
Some Major Changes
If you click the image, you'll be taken to the flickr with some more detailed screen shots as well.

Also, here's a google docs of the .pdf.
Also, here's a google docs of the .pdf.

Tuesday, March 15, 2011

Net Worth of Presidents and National Debt
http://www.creditsesame.com/blog/net-worth-of-american-presidents-vs-national-debt/
Monday, March 14, 2011
Japan
NY times homepage has a useful infographic of Fukushima plant using satellite images. http://nyti.ms/cjEzGm
Today's "Serious Play" Notes
· Video: Serious Play
· Tim Brown, May 2008 from Ideo
· Exercise: draw a quick sketch of the person next to you, 30 second sketch
o Findings: Audience’s embarrassment of showing ideas to peers or those considered peers
o This fear causes conservative behavior and thinking, restricts flow of ideas
o Kids have no embarrassment and readily share ideas, but adults do not and kids grow into this
· Trust makes it easier to take creative risks,
o Design interfaces and work environments made to relax people
· Symbols in work place remind people of a permissive environment, and encourage them to become playful, playfulness is important
· Creativity helps things get better and improves results
· Adults must relearn creativity and play to accomplish this
· Role playing limited or diminished throughout development
· Analogous/vicarious experiences are roleplayed prototype experiences
· Modes: divergent more playful and convergent more serious
o Movement through these two modes are important
· We need trust to play and trust to be creative
· Behaviors useful as kids: exploration, building, and role play
Dots are Back!
I figured since it was difficult for everyone to see the details, I'd upload a .pdf and share it. A few things are different, such as the colors of the map and I've begun to add the dots back in. Let me know what you think :)
Sunday, March 13, 2011
Hans Rosling's 200 Countries, 200 Years, 4 Minutes - The Joy of Stats - BBC Four
An infographic as a teaching/explanatory tool, used like a weatherman's map. Optimistic data, but very cool technology.
Video Link
Enjoy!
Video Link
Enjoy!
Thursday, March 10, 2011


Wednesday, March 9, 2011
Infographic! Project 1

I think the images are mostly done, I might have to do a little touching up. Sketches to digital images is new and fun, and time consuming :)
The text isn't finished yet, but the maps are complete, just got to add a key to differentiate between the colors. What do you all think ?
(there is a white border around the image and the text and branches do extend onto it, I realize displaying it here that it has a white bkgd, so the border is lost....)
Updated Infographic - Claire Edwins
My infographic is here. It's kind of small. If this is a problem let me know and I will try to make it bigger.
Infographic
 Here's my infographic so far. Pending on your suggestions, I think I am done with the graphics. I am still working on the text, I will be adding more information (and will be moving it around). I know it's a lot of text, but it's very difficult to explain otherwise. Any suggestions are appreciated. Thanks!
Tuesday, March 8, 2011
Project 1
Here is my infographic for project one. I still can't decide what to make my background color.
Monday, March 7, 2011
grain like rain

Here is my infographic, it's probably not that great, but i definitely put a lot of work into it... The purpose is to compare where grain comes from, and where it goes, and what countries can sustain themselves in a food crisis. I was inspired by Russia's ban on grain exports a little while ago, which caused a domino effect, since if a country needs to import large amounts of food, then if other countries stopped exporting, those countries would face a serious problem.
*Note: I noticed the textbox under india is crooked, and fixed that, but it's a lot of trouble to convert to a jpg, so I left this version up.
Saturday, March 5, 2011
Some Changes

I've updated my project since the last time I posted, so before you all comment on my last question, I wanted to give you the most up to date version.
Friday, March 4, 2011
My infographic so far!

Hey everyone,
Not sure if you can see this too clearly but this was the only way I could figure out to post it as a jpeg. What do you think of this layout? I decided vertical may be better to create more text space. Is it too much text? (I'm not done with all of it). I am trying to keep it simple with color, so I chose not to use many.
I'm going to be doing volunteering work in Mississippi during break so I will most likely not be able to check this until I get back.
Have an awesome break!!
Amanda
Thursday, March 3, 2011
SPRING BREAK :D
SPRING BREAK!!! YAAAAAY!!!!!!!!!!!!
I hope everyone has an enjoyable, relaxing break (and that we accomplish a lot on our projects).
Here's an infographic about spring break... http://www.onlineschools.org/blog/spring-break/
I hope everyone has an enjoyable, relaxing break (and that we accomplish a lot on our projects).
Here's an infographic about spring break... http://www.onlineschools.org/blog/spring-break/
Wednesday, March 2, 2011
Infographic Project
I was wondering what you guys thought about me placing the dots as the background and overlaying the titles and information on top. Let me know what you think please :)
Tuesday, March 1, 2011
2011 Adobe Design Achievement Awards
If anyone is interested in applying for 2011 Adobe Design Achievement Awards, check out the site with some more info.
The Adobe® Design Achievement Awards celebrate student and faculty achievement reflecting the powerful convergence of technology and the creative arts. The competition - which showcases individual and group projects created with industry-leading Adobe creative software - honors the most talented and promising student graphic designers, photographers, illustrators, animators, digital filmmakers, developers and computer artists from the world's top institutions of higher education.
Monday, February 28, 2011
Hello, guys. Since it was suggested, here are the links to the survey I'm doing for my infograph. If you would complete the survey, I'd appreciate it greatly. You don't have to answer every question, and the results are posted anonymously. There are two parts,
PART ONE http://www.surveymonkey.com/s/NKB5XT3
PART TWO http://www.surveymonkey.com/s/Z52T5FF
If you have any questions you can comment here or send an email to areitano@ufl.edu. Thanks!
PART ONE http://www.surveymonkey.com/s/NKB5XT3
PART TWO http://www.surveymonkey.com/s/Z52T5FF
If you have any questions you can comment here or send an email to areitano@ufl.edu. Thanks!
Good Map infographic
I think a couple of you guys are going to use a map in your infographic, and I found this infographic. I feel as if it uses maps very effectively because it has a varied color palette and icon legend. As opposed to the map river map that we looked at 2 weeks ago which had a very homogenous color palette and no legend.

Friday, February 25, 2011
From Good Magazine, a visually outstanding infographic
It is easy to read, simple and with a wonderful symbology: The Haitian Relief.
Thursday, February 24, 2011


Interesting Data Set
As always, the New York Times provides us with interesting formation in a clean and easy to read manner. Upon reading it, I was wondering why they didn't turn this into an infographic with the skills that we all know they have over there.
Wednesday, February 23, 2011
Some useful links for the projects! (and other things related for inspiration)
- Visualizing big numbers with real scale 1:1... One Million Book.
- Water waste, visualizing groups of people in space.
- Being sustainable... water footprint.
- Commodity price fluctuation by industry, originally posted by Sarah.
- Visualization critique: Comparing religions.
- Visualizing through maps: World Map of Religions.
- Interactive map: San Francisco Crimespotting.
- Vintage florida posters.
- Visualizing flowers, trees, leaves. Tree illustration.
- Comparative data on Christmas trees.
- Infographic to analyze a palm tree species.
- Insects... Visualizing the honey bee extinction, Facts about bees (illustration), Classification and characteristics of bees.
- Map: Drug use in the USA.
- Infographic, diagram, map: Our Favorite Drugs, The World of Drugs, The Cost of the War of Drugs.
- Drawing in Illustrator, using the pen tool. Phases of the pen tool. Download pen tool exercise.
- Live trace images in Illustrator.
Let me know if you need help finding information on specific topics.


Tuesday, February 22, 2011
PBS Infographic
This infographic was made in response to the government readying to cut public media funding: Click
Notes 2/21
On Making Field Research Visual : Maria Rogal
Ethnographic field research in Mexico supports graphic design work
Project : to visualize time in the context of the community
The desire for the project came from the community
- field notes do not need to be neat & organized
Diagrams of wheels of time - 6 prototypes, 18 group members, walk through with community
2 audiences - community & westernized Mexicans
Community has an oral tradition, the tool needs to be useful
Elders selected the circular prototype
- talking to people helps to understand peoples' needs, learn mistakes
There is a responsibility to share work
Because oral tradition, not everyone in community agreed
Their clothes tell stories & led to inspiration for project
Order/position of the text is important
Detail & color codes also important
Project map - different levels of information, can evolve
Information organization on orange juice bottles
- community wants people to know language & location
Honey bottle labels
- resonate well with community
Audience for bottles - tourists
Monday, February 21, 2011
Isotypes and iconography

Project 1 distributed by weeks, until Due Date
Hello!
We are in the second week after the presentation of Project 1, and we need to move fast to define everything related to it, because Spring Break is coming soon. These are the activities for the following days:
02.21.11: Quick presentation of topic. Justification, data found during the last days, information about topic. Preliminary audience. What's is the biggest problem to solve? (These issues correspond to the fist parts of the Creative Brief).
02.23.11: Creative Brief completion + Critique of First Sketches. The Creative Brief will serve as your base to continue developing your infographic in the next days. You will present the most important information from your Creative Brief to the class first. All of you are expected to give feedback to your classmates.
After talking about your Creative Brief, you will show your first infographic sketches. In big pieces of paper, make sketches, use color, propose structures, organizations of the information, iconography, etc. Don't work small, work in the biggest pieces of paper you can find! This will prepare you for the first prototype critique on 03.02.11. It is important to have a solid prototype to critique that day, because Spring Break is what follows.
After this critique, start working on the computer. Take into consideration the feedback and comments given in class from the rest of the class.
02.28.11: Personal meetings, students + Gaby. We will specifically define issues related to typography, hierarchy, color, scale, images or iconography. For that reason, it is imperative for you to show me print-outs or bring your computer with your visual ideas, as defined and resolved as possible.
After this meeting, make the changes needed and prepare your design for the First Prototype Critique on 03.02.11.
03.02.11: First Prototype critique. Presentation to the class of a real size printed prototype of your infographic ideas to date (plotter printing available at the architecture lab). Feedback from the class will be given, so, it is important to take notes and consider all the suggestions.
Use the following days to improve the design and carry out the user-testing activity. You are required to send me final prototype files through email anytime on March 4, 5, and 6. I will send you comments and suggestions so you can finesse the designs in time for user testing.
Spring Break (March 5-11). Use these days for user-testing activities (the earlier you do it the better). Remember that you have to keep notes and a photographic record of your user testing activity, which have to be included in your Creative Brief.
03.14.11: Final Prototype Presentation. Bring a printed prototype of your design. You will receive feedback to make the final changes before the final due date, on 03.16.11.
03.16.11: Final Infographic Critique. Formal presentation of your infographic, which will be supported by a one-page statement and your presence in the activity. Faculty from the School of Art will be invited to this presentation. You are also encouraged to invite faculty from your departments that day. This is an opportunity to show the new knowledge acquired and your ability to find a communication problem and solve it successfully.
Let's talk about this timetable in class. Remember that keeping the communication channels open between us is important to develop a better design process.
Thursday, February 17, 2011
Free fonts + Dingbats
Hi,
Check out this link. It offers the option to download a couple of really high quality fonts and a couple of dingbats collections that could work if you need some pre-determined iconography or look at symbols.
Check out this link. It offers the option to download a couple of really high quality fonts and a couple of dingbats collections that could work if you need some pre-determined iconography or look at symbols.
Typography Portraits
This is a really stunning use of typography:
http://27.media.tumblr.com/tumblr_lfu5ght9F51qgevvso1_500.jpg
as well as this compilation: http://abduzeedo.com/45-amazing-type-faces-typographic-portraits and http://www.hongkiat.com/blog/28-excellent-examples-of-typography-portraits/
http://27.media.tumblr.com/tumblr_lfu5ght9F51qgevvso1_500.jpg
as well as this compilation: http://abduzeedo.com/45-amazing-type-faces-typographic-portraits and http://www.hongkiat.com/blog/28-excellent-examples-of-typography-portraits/
Wednesday, February 16, 2011

More great infographics
check out the category list on the right side, may help to find relevant infographics for all of our diverse ideas!
http://www.visualinformation.info/
http://www.visualinformation.info/
Really Pretty Infographics
I really like all of these. I found the Burning Man one really interesting and kind of funny in a morbid way.
http://www.good.is/post/transparency-good-s-most-popular-infographics-of-2010/
http://www.good.is/post/transparency-good-s-most-popular-infographics-of-2010/
Infographic on Prices of Food
Commodity Price Fluctuations
Paul, here's a lot of information on the fluctuating prices of different foods used by a lot of communities. I hope it helps.
Glen, there's a graph of the price of coffee as well, but only up to 2009.
Paul, here's a lot of information on the fluctuating prices of different foods used by a lot of communities. I hope it helps.
Glen, there's a graph of the price of coffee as well, but only up to 2009.
More water/river-related infographs
http://cryscresc.net/world-rivers-day-infographic - World's Largest Rivers
href="http://unclutteredwhitespaces.com/2010/08/an-infographic-on-the-coming-water-wars/ - Water Wars
http://pixelfox.artician.com/portfolio/Save-Water/ - Save Water
http://cryscresc.net/world-rivers-day-infographic - World's Largest Rivers
href="http://unclutteredwhitespaces.com/2010/08/an-infographic-on-the-coming-water-wars/ - Water Wars
http://pixelfox.artician.com/portfolio/Save-Water/ - Save Water
Adobe Programs - What's the Difference?
Not being familiar with Adobe Illustrator or InDesign before the start of this course, I found this article useful for explaining the core differences between the programs (it also touches on Photoshop as well). Thought I'd share :)
Article
Article
In-Class Exercise References (02.16.11)
Hello!
Today we will use these links in our in-class exercise... If you have the chance to read the articles in advance, even better! –We will concentrate in the Mississippi River Map–
Something about Maps.
On River Maps.
Today we will use these links in our in-class exercise... If you have the chance to read the articles in advance, even better! –We will concentrate in the Mississippi River Map–
Something about Maps.
On River Maps.
Tuesday, February 15, 2011
Poster-Style Infographics Site
A whole site dedicated to poster-style Infographics. To help our creative, brainstorming thoughts for our first project :)
Style & Flow
Style & Flow
Really interesting, interactive infographic on the number of times things are mentioned on social media sites.
Monday, February 14, 2011
smoking

Here is an interesting infographic expressing the black market tobacco trade
it shows many different infographic strategies.
Thursday, February 10, 2011
Wednesday, February 9, 2011
For all of you who are like me...
"Learn the Basics of Photoshop in Under 25 Minutes" by Adam Dachis with Lifehacker.
http://lifehacker.com/#!photoshop/5753459
Lifehacker also has a couple more posts about Photoshop, and just a wealth of cool information. The whole Gawker media blogosphere is amazing - there's something for everyone.
http://lifehacker.com/#!photoshop/5753459
Lifehacker also has a couple more posts about Photoshop, and just a wealth of cool information. The whole Gawker media blogosphere is amazing - there's something for everyone.
Daily Infographics
You can have a new infographic delivered to your inbox daily! Check this out:
http://dailyinfographic.com/
http://dailyinfographic.com/
Tuesday, February 8, 2011
Monday, February 7, 2011
Creating Your Own Fonts
This website allows you create your own fonts through its own on-site builder. You can save, share, and download and use the fonts you make as well as fonts made by other users.
Images from Class
For those of you who didn't get a chance to jot down everything from the lecture in class Monday, here's a website with all of the information in one place to make studying much easier.
Egypt
Also, here's a very interesting infographic that displays the role that twitter is playing in the Egyptian Crisis right now. It's interesting how integrated twitter has become within news outlets and journalism.
If you have a twitter, search #infographic and you'll definitely come across a wide variety of interesting things that are very relevant to what's going on around us.
Superbowl
To connect to this weekend's festivities, I figured I'd share this infographic with everyone. If you're into football or the superbowl, you'll probably find it interesting.
Saving files in InDesign CS4 from CS5
Hello,
I forgot that saving a file in CS5 to be opened in CS4 is not exactly easy, the wording is a little bit confusing.
For doing so you have to use File > Export and choose InDesign Markup Language (IDML). This will let you open it in CS4.
I honestly ignore why the Adobe people decided to rename this action... It used to be very easy before.
I guess this will clarify the confusion. :)
Article - Data artists: Visualization as a gateway drug
http://www.newscientist.com/blogs/culturelab/2011/02/data-artists-visualisation-as-a-gateway-drug.html
Also check out the link to the Many Eyes project!
Friday, February 4, 2011
Data Pathways in Science
The link is for a KEGG Pathway, reference pathway. (KEGG is Kyoto Encyclopedia of Genes and Genomes)
Posted this of an example of an information graphic that is used more as a resource than as a news sensation. It is an overwhelming amount of information, especially since genomes and biochemical pathways are not my forte, but it is pretty impressive. :)
Posted this of an example of an information graphic that is used more as a resource than as a news sensation. It is an overwhelming amount of information, especially since genomes and biochemical pathways are not my forte, but it is pretty impressive. :)
Wednesday, February 2, 2011
Simple Infographic.
In the film Journalism in the Age of Data we saw that a lot of the info-graphics were made using java, php and various other computer programs. I was looking online for simple ones that we could do. This one seems like we could do just using Illustrator. I would like practice composing these shapes and such.
Co.Design Infographics
Not only does this website have lots of stunning infographics to browse (it has an Infographic of the Day feature), it also has a variety of articles about design. I found the layout of the website itself visually interesting; I especially like the colored bars that allow you to search the archives by date.
http://www.fastcodesign.com/tag/infographic
There's also a funny app that I found through the Co.Design site. It shows the asymmetry of your face. The results are not very realistic, but I'm definitely going to check it out in the App Store.
http://echoism.org/
Hope you all enjoy the sites and are having a good week so far. See you tonight!
Tuesday, February 1, 2011
Friday, January 28, 2011
here's a nice straightforward and interactive infographic
also relevant to our discussion of innovation..
Wednesday, January 26, 2011
a new collection of infographics
I found this new list of interesting infographics. Take a look at them... are they efficient or not? what kind of visual elements are being used in a good or bad way?
http://psd.fanextra.com/articles/30-really-informative-and-beautiful-infographics/
http://psd.fanextra.com/articles/30-really-informative-and-beautiful-infographics/
Design Critique
Hello,
Please read this little article...
http://thinkvitamin.com/design/the-art-of-the-design-critique/
It talks about giving and receiving feedback in a design project. I think it is easy to read and the info also applies to us. :)
Please read this little article...
http://thinkvitamin.com/design/the-art-of-the-design-critique/
It talks about giving and receiving feedback in a design project. I think it is easy to read and the info also applies to us. :)
Tuesday, January 25, 2011
thinking on creating an infographic based on comparisons...
This is another good example of an infographic that deals with comparative data.
http://trulia.movity.com/rentvsbuy/
Enjoy!
http://trulia.movity.com/rentvsbuy/
Enjoy!
Monday, January 24, 2011
Awesome presentation creator tool!
I was at a club meeting recently and noticed that the presenter had a really interesting presentation form. She said she used Prezi.com. I haven't personally used it yet, but she said it's relatively easy to use as well as fun (and free). I think these are much more effective than regular powerpoint presentations because they zoom in for detail, and always zoom back out so the audience can see the big picture. There are some nice examples on the home page, as well as tutorials for using the site.
Prezi.com
Prezi.com
Lecture 3 Notes
Framing, Hierarchy, and Layers 1/24/11
Framing
- Picturing objects
- Some elements related: cropping, borders, margins, and captions
- Affects how we perceive information
- Contain an image or a piece of it
- Can divide its image from its background
Cropping
- Helps redraw borders and alters the shape of original picture
- Changes scale of the elements, direction or form, or focus of the picture
Margins and Bleeds
- Margins
-provide a protective frame around contents
-provide space for other info
Framing text and images
- Adding text to a picture changes its meaning
- Text could be subordinate or dominant to a picture
- Text can respect or ignore the borders of an image
Borders
- Frontier between inside and outside
Hierarchy
- Marks the order of importance of different elements in the same space
- Conveyed visually through variations in scale, value, color, etc.
- We want visual order!
- Uses clear marks of separation to signal a change from one level to another
Basic Typographic Hierarchy
- Example: table of contents
- Provides a structural picture
- Helps provide an image of how the book is organized
- Can use alignments, leading, indents, type sizes and colors
Layers
- Simultaneous overlapping components of an image or sequence
- Used in many media programs
- Maps use overlapping layers to associate and separate different levels of data
- Printing techniques use multiple layers of ink to build a single image
Transparency
- Used to create dense, layered imagery built from veils of color and texture
- Any surface in the physical world is transparent or opaque
- Photoshop allows you to adjust the opacity
- “Transparent” image or surface generally opaque to some degree
- Transparency and layers are related phenomena
- Viewer perceives the transparency of one plane in relation to a second one
- Builds complexity
Corporative infographic
Check this out!
http://mashable.com/2011/01/24/foursquare-6-million-infographic/
really interesting! nice use of color, hierarchy and scale.
http://mashable.com/2011/01/24/foursquare-6-million-infographic/
really interesting! nice use of color, hierarchy and scale.
Sunday, January 23, 2011
Another cool infographic, check it out!
Hi!
Another nice infographic... Why do marriages fall apart?
http://www.fastcodesign.com/1663044/infographic-of-the-day-why-do-marriages-fall-apart
Enjoy! :)
Another nice infographic... Why do marriages fall apart?
http://www.fastcodesign.com/1663044/infographic-of-the-day-why-do-marriages-fall-apart
Enjoy! :)
Saturday, January 22, 2011
Interesting infographic
Hello!
First of all, thanks for all the post!!! All of them are really interesting and useful!
I found this infographic. I think is visually interesting and fun.
http://grasshoppergroup.com/wp-content/uploads/2011/01/AwesomeEvolutionoftheInternet.jpg
Gaby
First of all, thanks for all the post!!! All of them are really interesting and useful!
I found this infographic. I think is visually interesting and fun.
http://grasshoppergroup.com/wp-content/uploads/2011/01/AwesomeEvolutionoftheInternet.jpg
Gaby
Friday, January 21, 2011
Lecture 2 Notes
LECTURE 2 01/19
TEXTURE, COLOR, FIGURE/GROUND
TEXTURE
- add richness to design
- tells a lot about the object – show don’t tell
- creates a mood
- can add contrast/detail/surface quality
- using opposites (contrast) amplifies each texture
PHYSICAL
- everything you touch has texture
- tactile sensation adds more to visuals
- different materials reflect different amounts of light (glossy/matte)
VIRTUAL
- optical effects of elements in graphic
- many ways to create texture (pictures, drawing, on the computer)
CONSIDER – carbonica website, Van Gogh, textual images, concrete
COLOR
- surfaces absorb certain light waves and reflect others
- color is pretty routine in our lives
- infinite amount of different colors
PERCEPTION
- color is relative to the viewer
- surrounding colors can influence look of other colors
- color depends on the amount of light
- hue/saturation/intensity/tint/shade/value (p. 74 in textbook)
COLOR PRODUCED BY LIGHT (RGB)
- red green blue mixed to white
- real life and on a screen – computer, tv
- additive – you add them together to get other colors
PIGMENTATION (CMYK)
- cyan, magenta, yellow mixed to black
- the colors you deal with when printing
- subtractive
COLOR WHEEL
- primary colors – red, yellow, blue
- secondary colors – orange, green, purple
- tertiary colors – blends of primary and secondary
- complimentary colors – opposites on wheel
- analogous colors – close by on wheel – similar
FIGURE/GROUND
- the relationship between figure and the background
- a.k.a negative and positive space
- separation and contrast
- background is active, consider it
3 MAIN STRUCTURES
- stable – figure stand clearly apart from background
- reversible – pos. and neg. elements attract equal attn.
- ambiguous – challenges viewer to find focal point
CONSIDER – optical illusions where the elements compete for your attention, maps
NOTE – begin thinking about first project, what kind of things interest you and what kind of things would be visually compelling, also DON'T FORGET letterform abstraction project due on Monday
Wednesday, January 19, 2011
Infographic from Video
I'm not sure if this is the exact same graphic mentioned in "Journalism in the Age of Data", but it is in the same style. I wanted to explore it further, due to the questions raised about it in the video.
http://www.nytimes.com/interactive/2008/02/23/movies/20080223_REVENUE_GRAPHIC.html
http://www.nytimes.com/interactive/2008/02/23/movies/20080223_REVENUE_GRAPHIC.html
Tuesday, January 18, 2011
Tutorials for Illustrator
The Adobe website has some cool tutorials, in case you're new to Illustrator like me! I also found this website that looks promising.
http://www.ndesign-studio.com/tutorials
http://www.ndesign-studio.com/tutorials
Paint Sculptures
So..this isn't exactly an infographic or anything relating to data visualization, but it's so incredibly cool that I had to share it with someone :)
Ted talk using infographics: Changing Education Paradigms
http://www.ted.com/talks/ken_robinson_changing_education_paradigms.html
Monday, January 17, 2011
Sunday, January 16, 2011
Interesting Site With Infographics
http://www.mikewirthart.com/?cat=3
Mike Wirth is a designer, educator and artist, who specializes in information design and visualization. Mike holds a Master of Fine Arts degree in Design and Technology from Parsons School of Design and a Bachelor of Fine Arts degree from Long Island University in Digital Art and Design. Currently, Mike is an Assistant Professor of Art and directs the New Media Design major at Queens University of Charlotte, in North Carolina.
A few notable exhibition spaces include: Rockefeller Center and the Chelsea Art Gallery in New York, NY, Split New Media and Film Fest in Split, Croatia, The WRO Wroclaw Media Art Biennale in Wroclaw, Poland, and The Institute of History and Art in Albany, New York. In 2010 Mike was a featured artist at the inaugural TEDxCharlotte conference. Mike has won two awards for his historical documentary about the language of gesture, including “Best Short” and “Official Selection” at the Ed Wood film festival (2004 Albany, NY) as well as “Official Selection” at the DigIt New Media Fest (2005 Narrowsburg, NY).
Professionally, Mike has operated his own freelance design business since 2000, during which time he has worked on unique projects with notable clients, including: Mozilla, Lookout Mobile Security, Hubspot, Siemens Building Technologies, Anheuser Bush, John F. Kennedy Center, PBS via Interactive Knowledge, Pints for Prostates, York County Museum, Lightfactory Museum of Film and Photography, ESPN-Outdoors, Columbia University Teachers College.
In 2009 Mike was a part of a research project called Dance.Draw, that received a National Science Foundation Creative IT grant ($250K.)
In 2010 Mike and Dr. Suzanne Cooper-Guasco took home a $5K first prize in the Sunlight Foundation “Design for America Competition”. Their “How Our Laws Are Made” infographic took top honors and has been featured on HuffingtonPost.com, WashingtonPost.com, TheAtlantic.com, and Comedy Central.com.
Wednesday, January 12, 2011
Lecture One
Point, line & plane
Point
Line
Plane
Space and Volume
o Does not reflect the position of the viewer
Rhythm & balance
o In design, balance anchors and activates elements in space. Relationships among elements on the page or screen remind of physical relationships
o VISUAL BALANCE
o Asymmetrical designs are generally more active than symmetrical ones.
o Designers achieve balance by placing contrasting elements
Scale
- Kandinsky | A line is the track made by the moving point. It is created by movement-specifically through the destruction of the intense, self-contained repose of the point.
- Point, line & plane are the building blocks of design. From these elements, you can create images, icons, textures, patterns, diagrams, animations, and typographic systems.
Point
- Marks a position in space
- Pair of x and y coordinates.
- It has no mass at all. Graphically, however, a point takes form as a dot, a visible mark.
- A point can be an insignificant fleck of matter or a concentrated locus of power.
- A series of points forms a line. A mass of points becomes texture, shape, or plane. Tiny points of varying size create shades of gray.
- In typography, the point is the period- the definitive end of a line.
Line
- A line is an infinite series of points
- Geometrically, a line has length, but no breadth.
- Is the connection between two points.
- Is the path of a moving point.
- Can be a positive mark or a negative gap.
- Can appear at the edges of objects and where two planes meet.
- Can exist in many weights, thicknesses, and texture.
- When a line reaches a certain thickness, it becomes a PLANE.
Plane
- Flat surface, extending in height and width.
- A place is the path of a moving line or a line with breadth.
- A line closes to become a shape, a bounded plane. Shapes are planes with edges.
- In vector-based software, (Adobe Illustrator) every shape consists of line and fill.
- A plane can be parallel to the picture surface, or it can skew and recede into space.
- Ceilings, walls, floors, and windows are physical planes.
Space and Volume
- A graphic object that encloses 3D space has volume. It has height, width, and depth.
- A sheet of paper or a computer screen has no real depth, so volume is represented through graphic conventions.
- Linear perspective simulates optical distortions, making near objects appear large and far objects appear small.
- The angle at which elements recede reflects the position of the viewer (eye level)
- Axonometric Projection
o Does not reflect the position of the viewer
Rhythm & balance
- Balance
o In design, balance anchors and activates elements in space. Relationships among elements on the page or screen remind of physical relationships
o VISUAL BALANCE
- Occurs when the weight of one or more things is distributed evenly or proportionately in space.
- Like arranging furniture in a room, we move components around until the balance of form is suitable.
o Asymmetrical designs are generally more active than symmetrical ones.
o Designers achieve balance by placing contrasting elements
- Repetition & change
- Rhythm & time
- Content can be distributed across the page or across many pages.
- In a one-page design, a sequential design must possess an overall coherence.
- All the design elements are places with an intention, to create focal points and create a visual pace.
- Underlying grid system helps bring order to a progression of pages.
- Key: an element of surprise and variation is important to keep interest.
Scale
- Scale is relative
- When elements are all the same size, the design feels flat. Contrast in size creates tension and depth/movement.
- Objective | literal dimensions
- Subjective | scale refers to one’s impression of an object’s size.
Subscribe to:
Comments (Atom)